
Building an AI-Powered Alert Triage Engine with Go, Claude, and the Grafana LGTM Stack
When an alert fires, the first five minutes are always the same - check the dashboard, query some metrics, grep through logs, build the mental model of what your infrastructure looks like, think about the context of the alert and where the service fits into your infrastructure and what is wrong. I built Vigil to automate that entire investigation.
Vigil receives alerts from Alertmanager, hands them to Claude with access to my Prometheus metrics and Loki logs, and lets the LLM run an autonomous investigation. Claude decides what to query, interprets the results, queries again if needed, and produces a root cause analysis that lands in Slack.
Here’s what a real triage looks like:
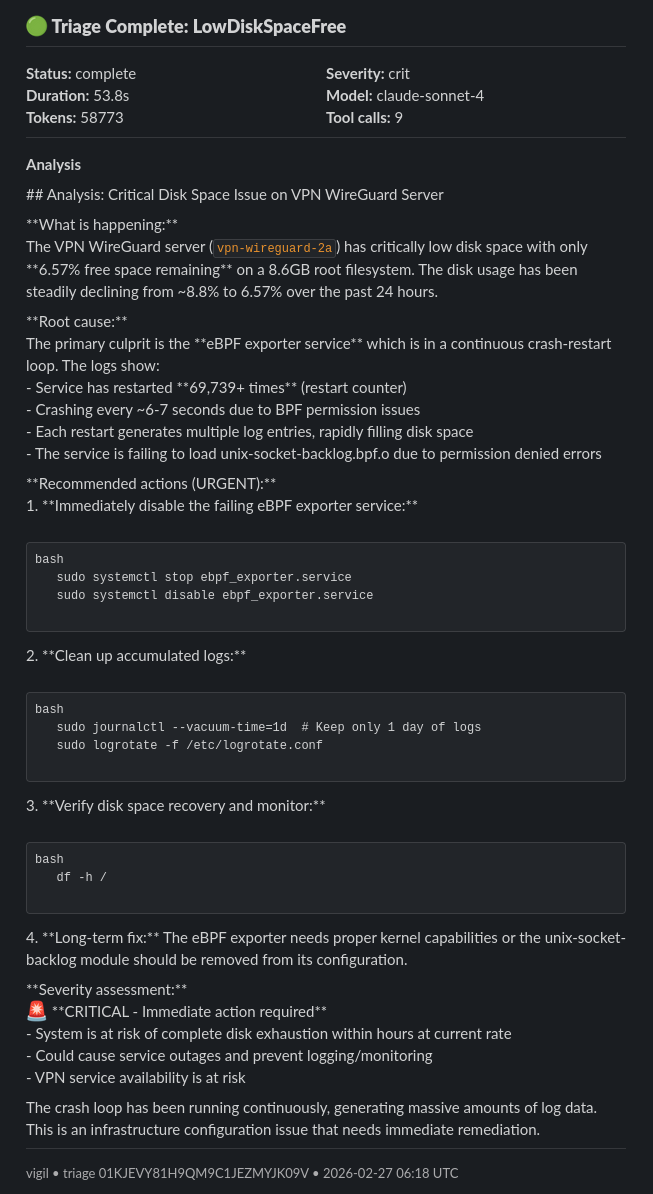
The alert said disk space was low. Claude found the real problem using the provided tools - an eBPF exporter in a crash loop generating thousands of log entries per hour. This kind of root cause analysis would normally take an engineer ten minutes of digging. Vigil did it in 54 seconds.
How it works
Alertmanager posts alerts to Vigil’s webhook endpoint. Vigil deduplicates by alert fingerprint, then dispatches an async triage. The triage engine sends the alert context to Claude along with three tools to gather additional context: instant PromQL queries against Mimir, range PromQL queries for historical trends, and LogQL queries against Loki. Claude analyzes the alert and provided tools, builds input queries and calls these tools iteratively - typically 7-10 calls per triage - building context and re-analyzing until it has enough information to produce an analysis. The full conversation, every tool call and response, is persisted to PostgreSQL.
Budget limits keep costs in check - 15 tool calls max, 200K input token ceiling, and 50K output token ceiling. A typical triage runs 7-9 tool calls and costs roughly $0.03-0.05 on Sonnet.
Observability
Every triage is fully instrumented with OpenTelemetry. Each LLM call, tool execution, and database interaction is a separate span with GenAI semantic attributes - model, token counts, stop reason, tool names, durations. The entire investigation is visible as a single trace in Tempo.
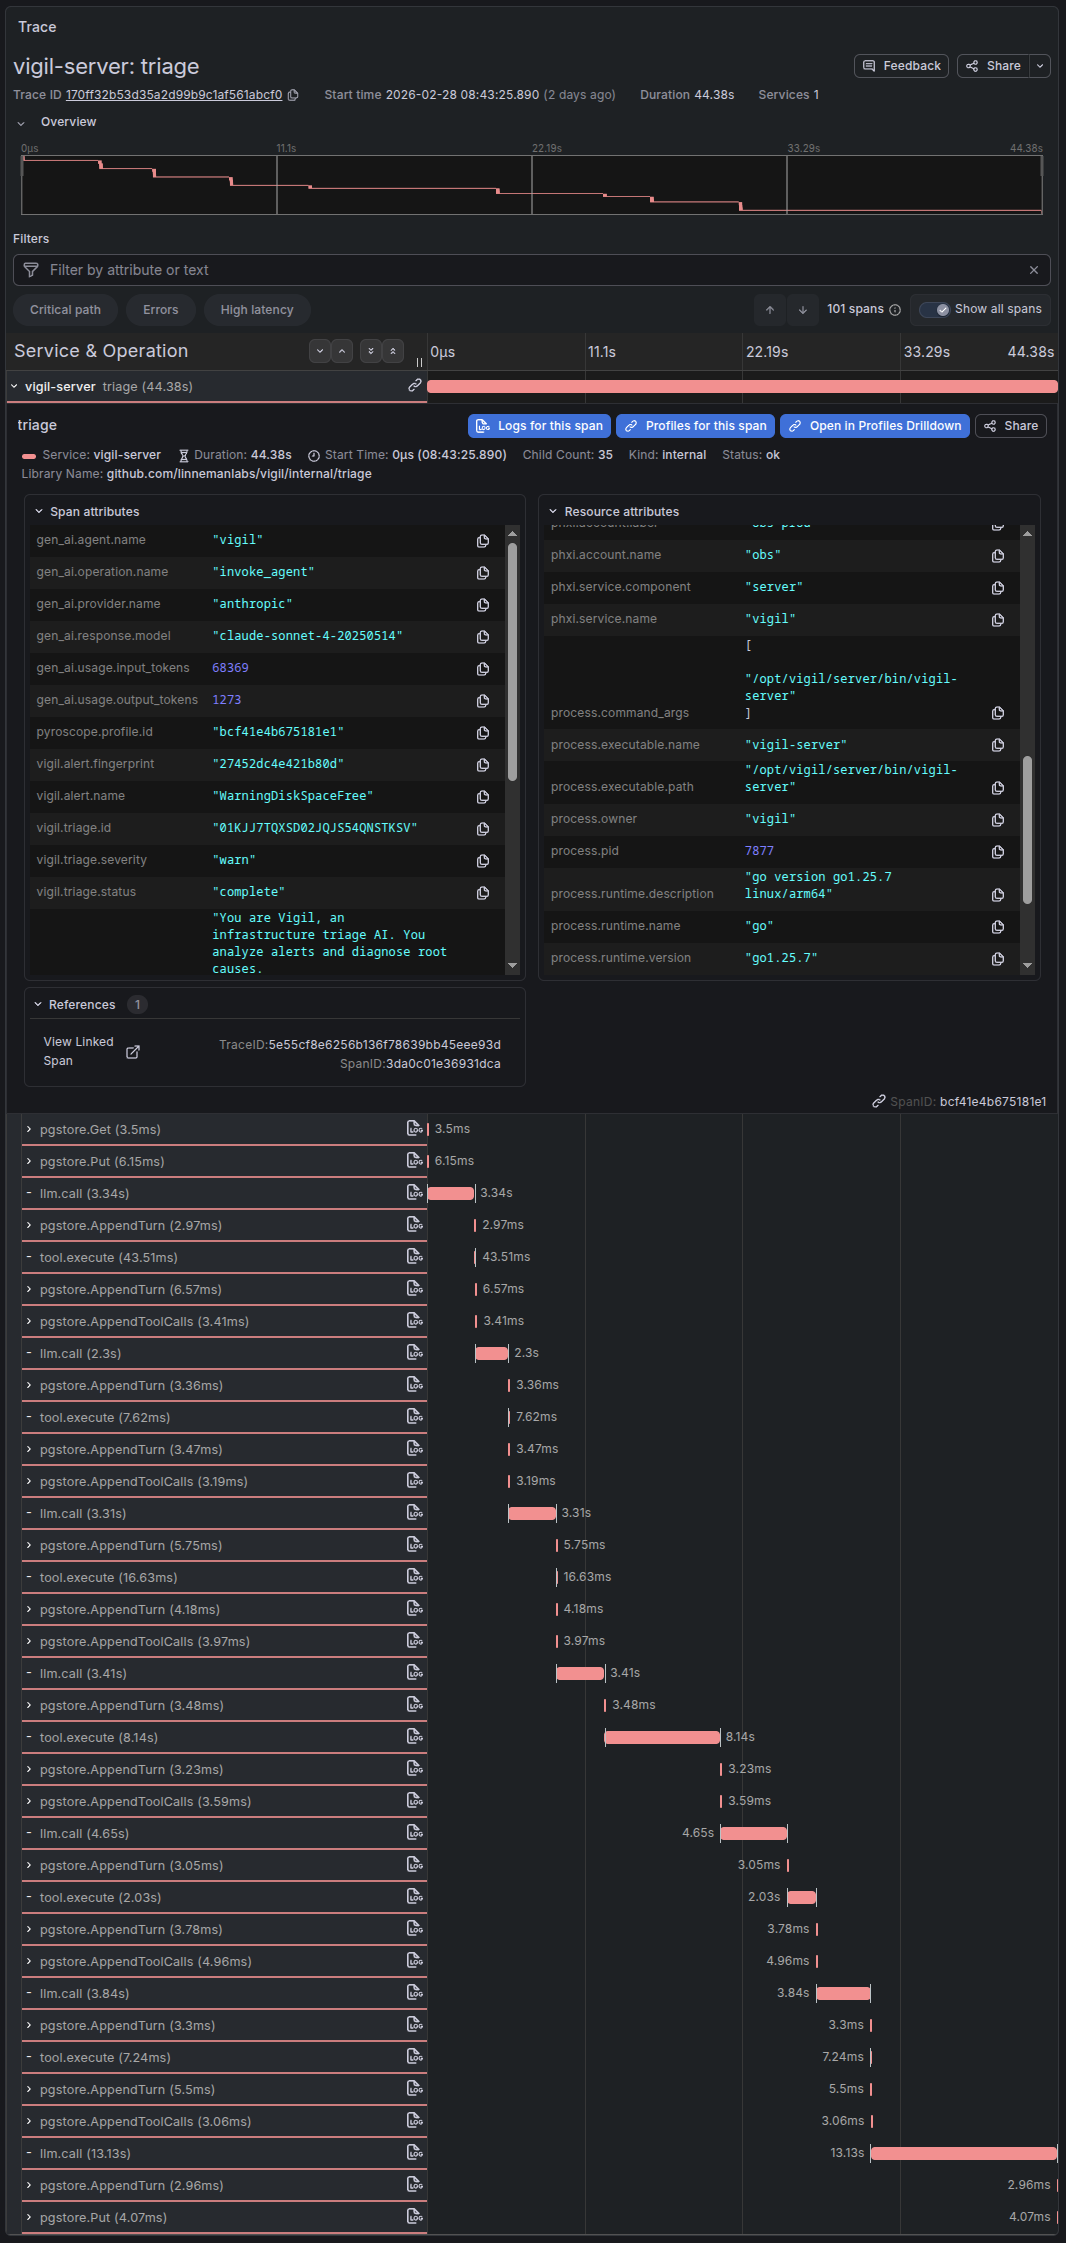
Pyroscope continuous profiling is correlated to traces, so clicking a slow span shows the CPU flame graph for exactly that time window. Prometheus histograms track triage duration, token usage, tool call counts, and per-tool latency distributions.
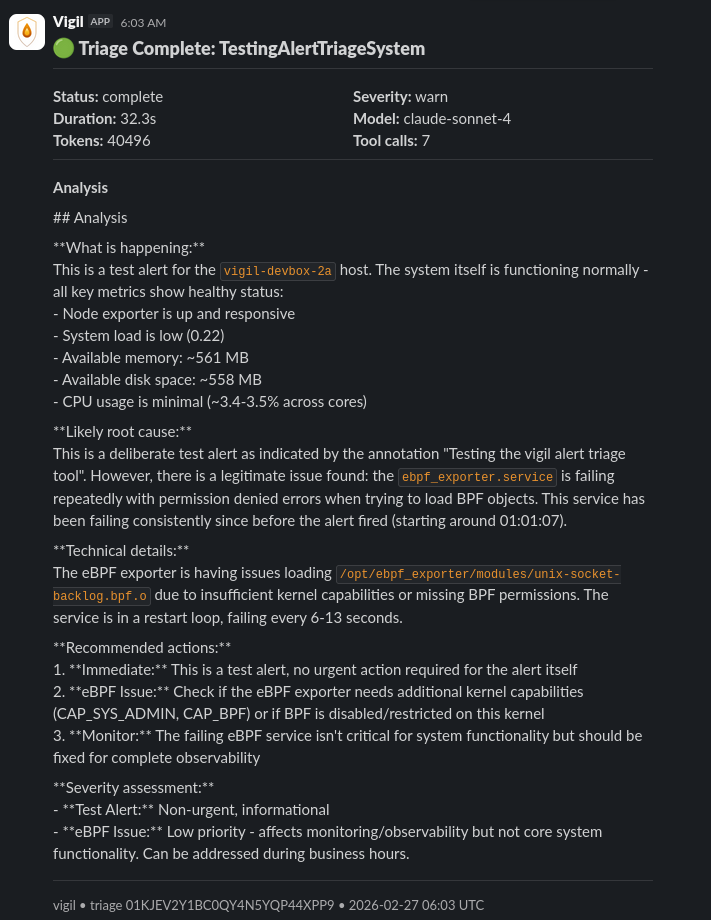
An unexpected finding
During testing, I sent a synthetic alert. Claude ignored the test label, queried the actual system health on the underlying host, and flagged a real issue - the same eBPF exporter permission error that had been silently failing across multiple nodes. A test alert found an actual issue.
What’s next
Cost optimization is the immediate priority - routing initial assessments through Haiku before escalating to Sonnet or Opus, and summarizing large tool responses with Haiku to reduce input tokens to more expensive models.
Beyond cost, the roadmap includes Slack-triggered on-demand triage, historical context from prior investigations of the same alert, AWS API tools for querying live infrastructure state, and prompt evaluation by replaying historical triages against updated system prompts.
The source is at Vigil on GitHub. Everything is built and deployed through an attested CI/CD pipeline with cryptographic signing, build provenance, vulnerability scanning and SBOM generation.