
Building a Self-Hosted Observability Platform with the Grafana LGTM Stack
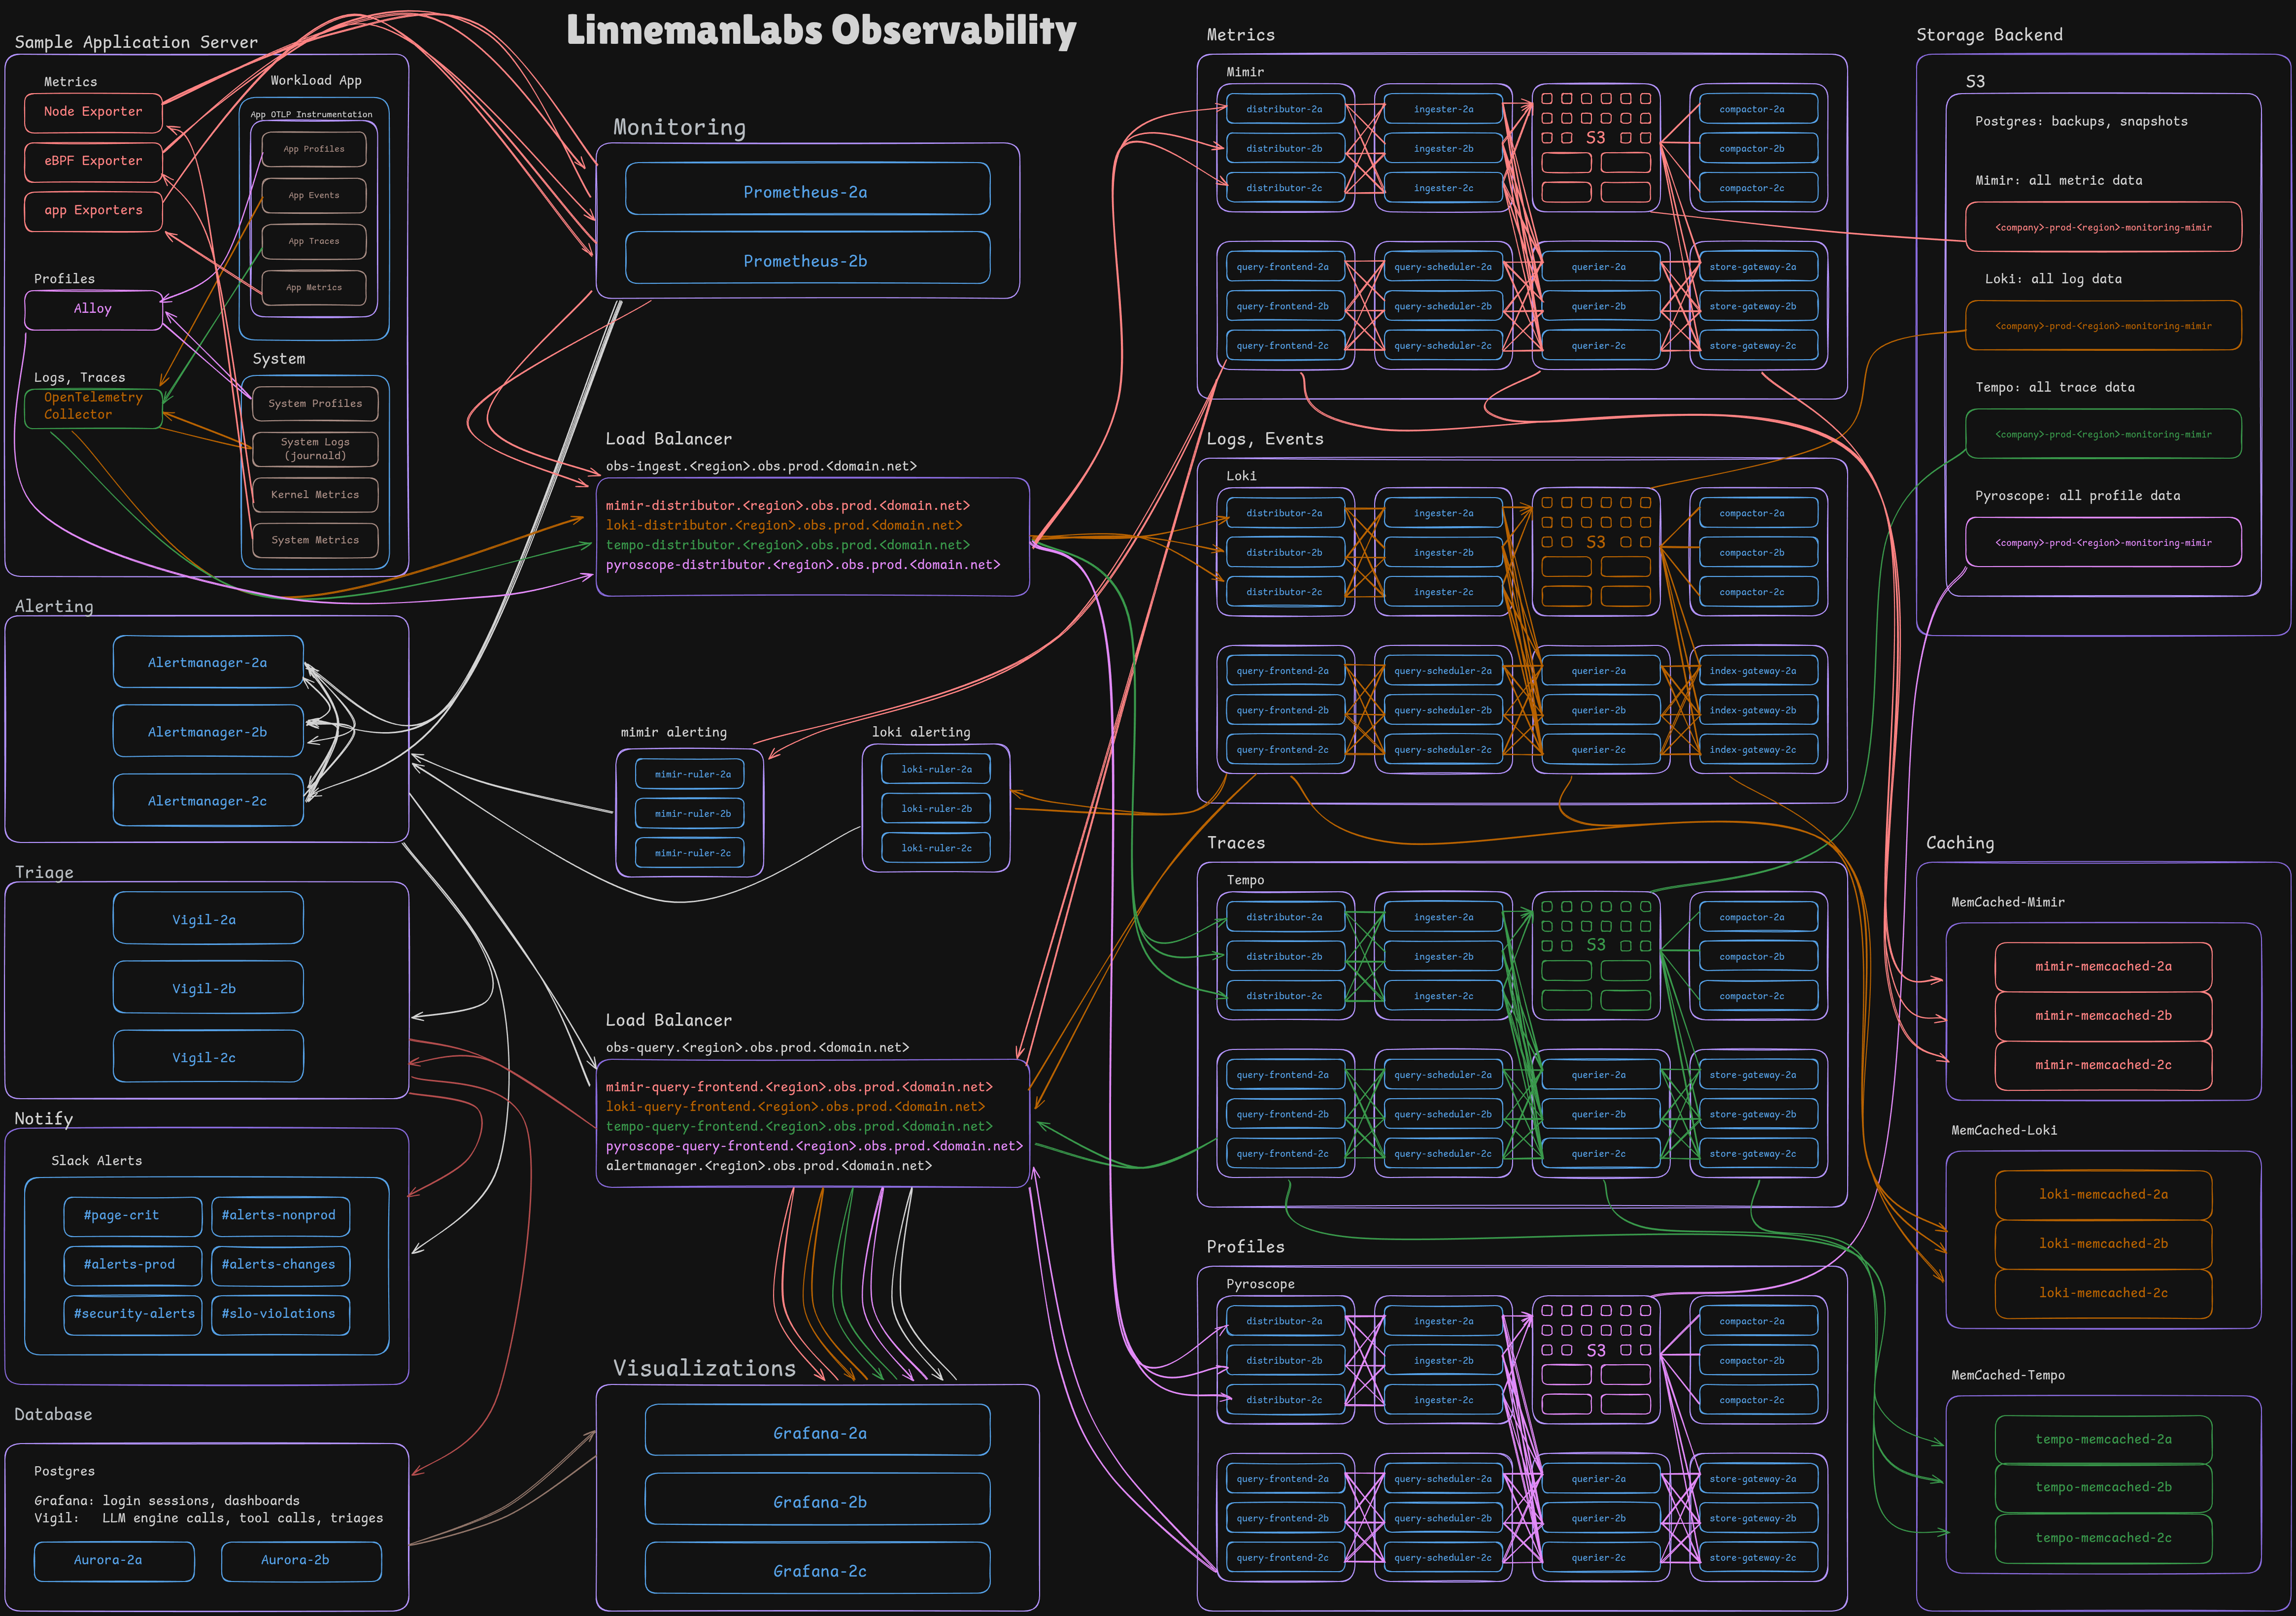
Architecture
A picture is worth a thousand words. What’s an architecture diagram worth?
Background
I’ve run just about every mainstream monitoring tool from Nagios to the ELK stack and written many of my own homemade solutions. When my mindset shifted from monitoring to observability several years ago I knew I needed entirely new tooling and set out to rebuild from scratch.
I chose the Grafana LGTM stack because it is standards-based (OTLP), the shared object storage backend is an elegant solution to many challenges that works well with time-series databases, and the tight cross-signal integration and ease of correlation and linking across dashboards.
The platform currently spans 118 nodes across 8 AWS accounts.
How It Works
Every node in my environment runs a golden ami that is fully instrumented for integration to the observability platform. Applications I write are instrumented with my reusable Go libraries using the otel and pyroscope-go SDKs for emitting OTLP logs, traces, metrics and profiles.
Metrics
node_exporter, ebpf_exporter and service-specific exporters. Applications are instrumented to expose a metrics endpoint or have a sidecar exporter like memcached-exporter. Prometheus polls from these endpoints every 15s. Prometheus maintains a list of alert rules and will fire an alert to AlertManager if a node is unreachable or if a metric violates conditions.
Logs
otel_collector watches filelogs, journald, and receives OTLP logs from instrumented applications. These are pushed to Loki, which runs loki-ruler with a list of alert rules and will fire an alert to AlertManager if an individual log line or aggregate log statistics violate conditions.
Traces
http requests are instrumented to trace requests through the full pipeline. I add additional spans for each database call, external api call, meaningful processing work, etc, with significant attribute labeling to show detailed data on database queries, api call parameters, etc. When appropriate for more verbose data I add span events for large pieces of data like api responses, etc.
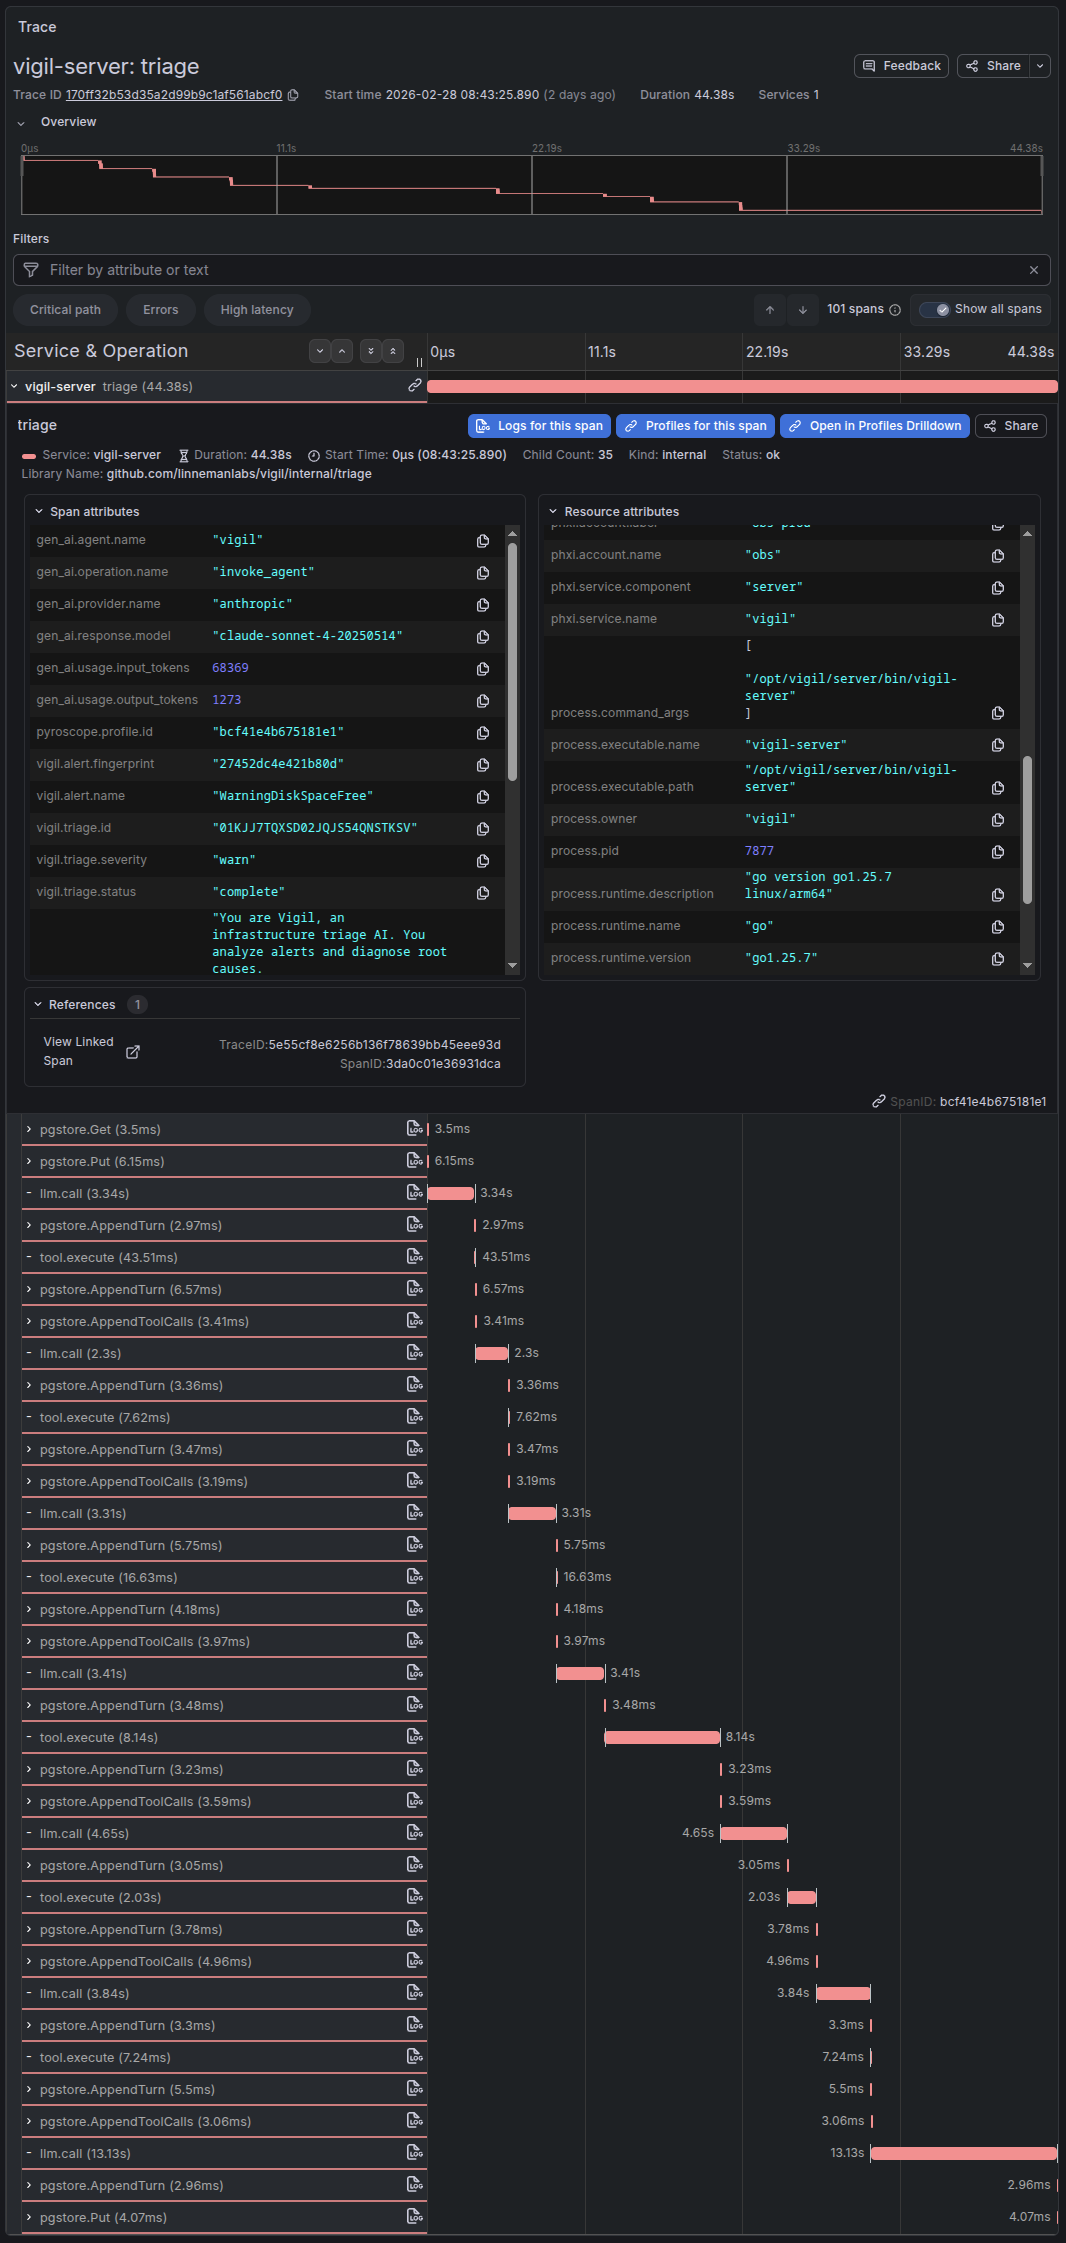
A real trace in Tempo from Vigil - LLM calls, tool executions, and database writes as spans Profiles
I run continuous system profiling using Grafana Alloy that ships to the Pyroscope http api. Applications are instrumented to perform continuous profiling and push those profiles to Pyroscope through Alloy.
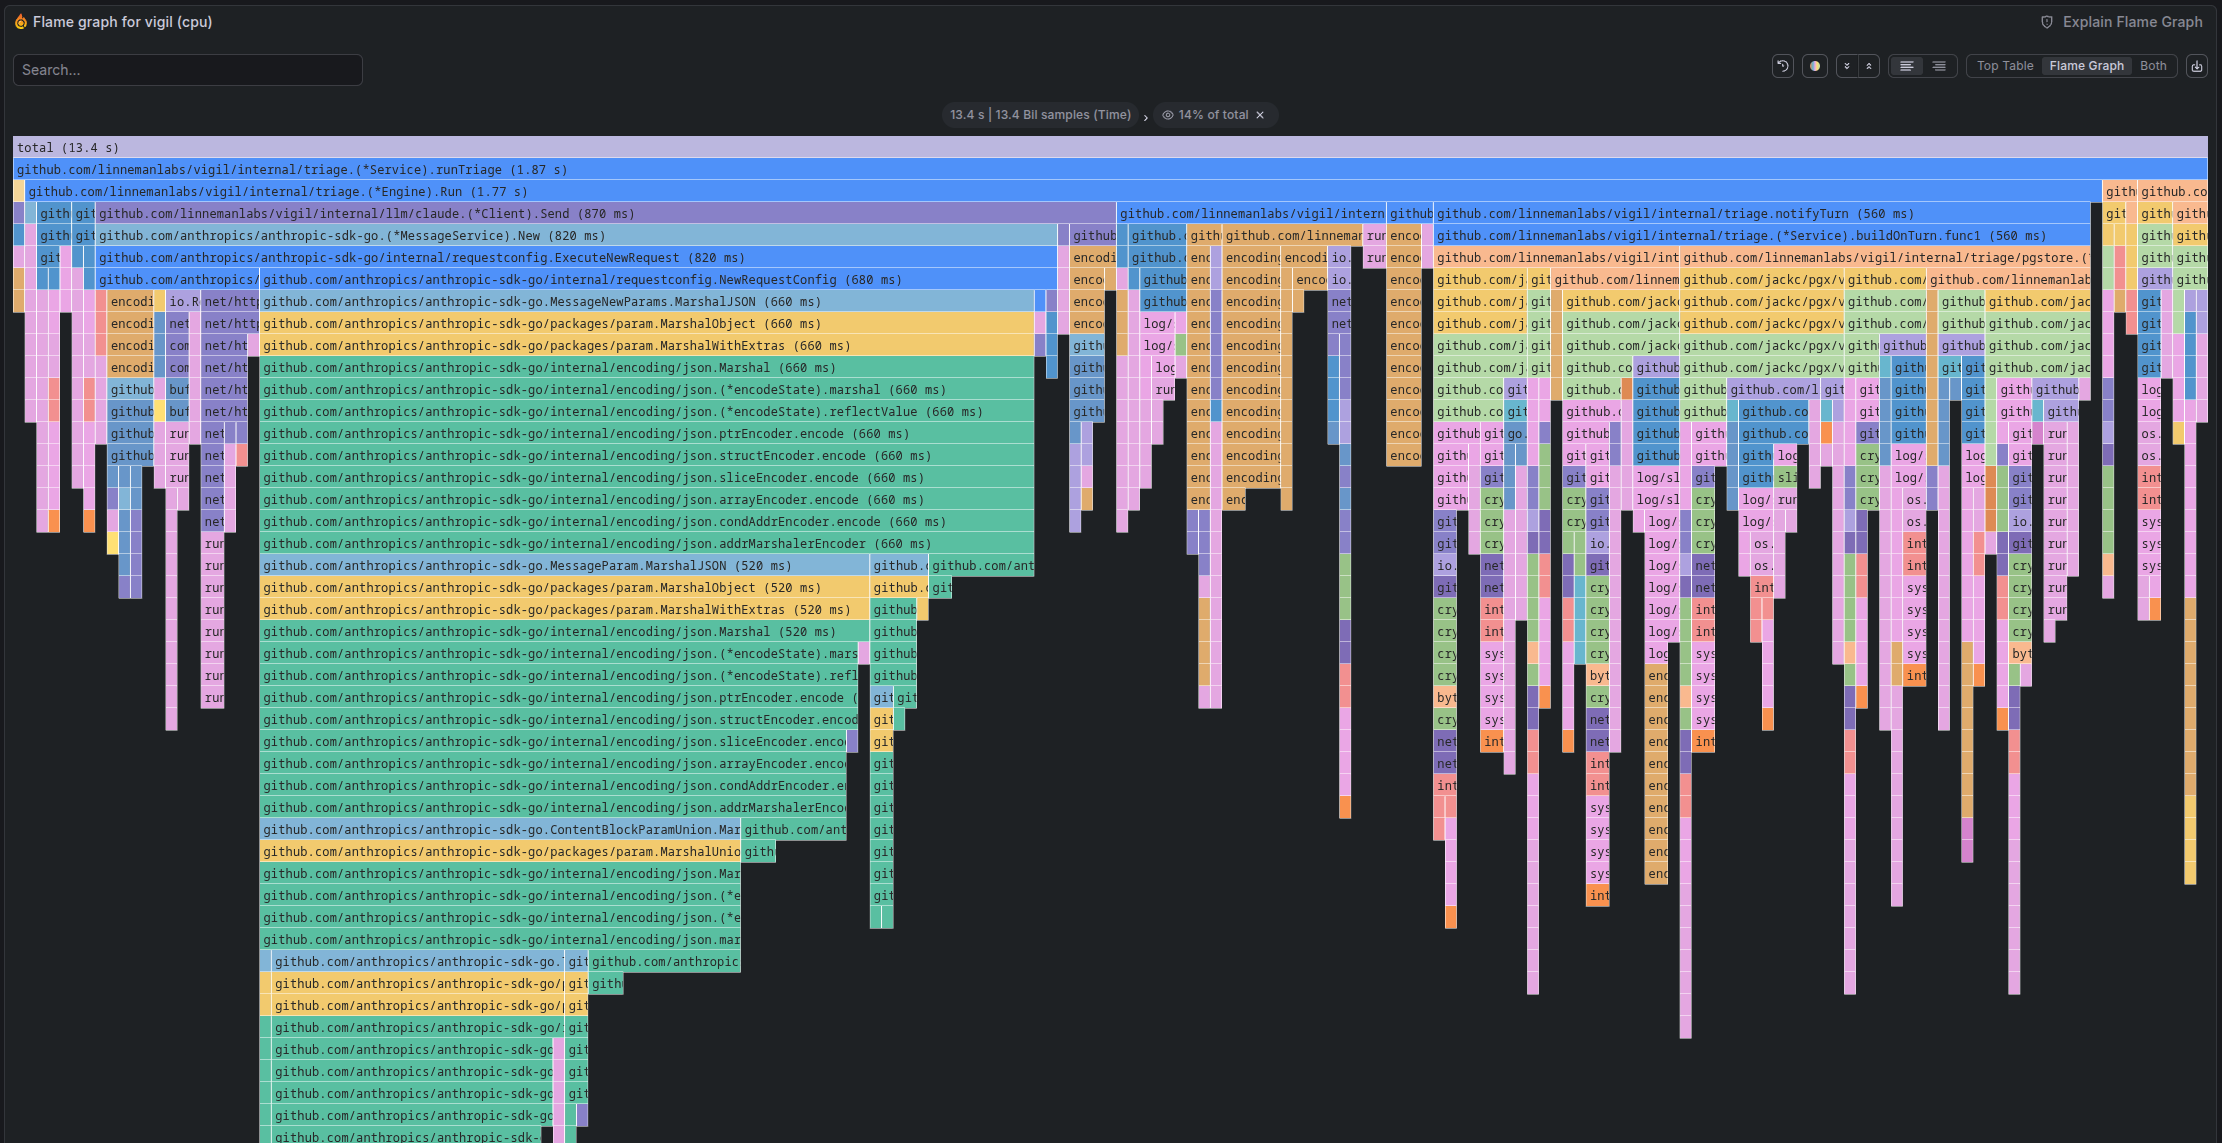
Pyroscope flamegraph showing CPU time across Vigil's triage execution path Alerts
Alertmanager collects and de-dupes alerts and fires notifications to Slack. At the same time it notifies Vigil to begin a triage.
Triage
I built Vigil for AI-powered triage to receive alerts from AlertManager and query LLMs providing tools to iteratively query the observability stack and build context to provide an analysis. A final analysis is sent to Slack.
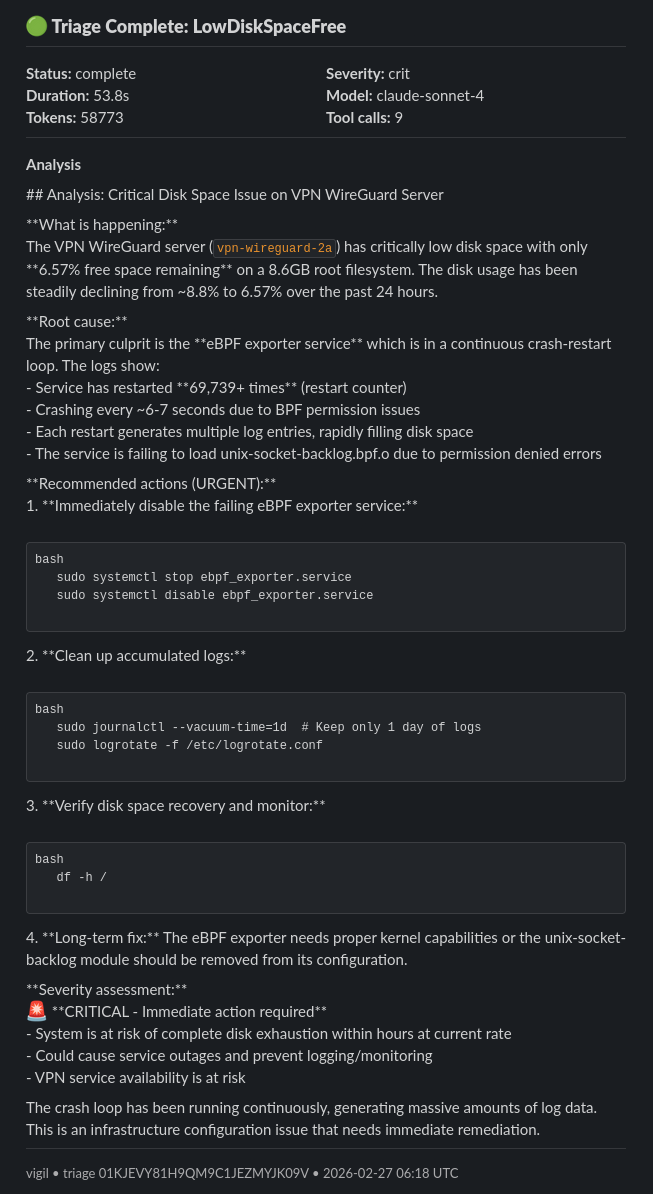
Vigil alert triage sent to slack Visualizations
I create many dashboards for each service in my infrastructure. I typically organize them into high-level environment summary operational dashboards (SLI/SLO/SLA), high-level per-service summary dashboards (status of individual microservices, service throughput, etc), and detailed deep-dive dashboards for each component.
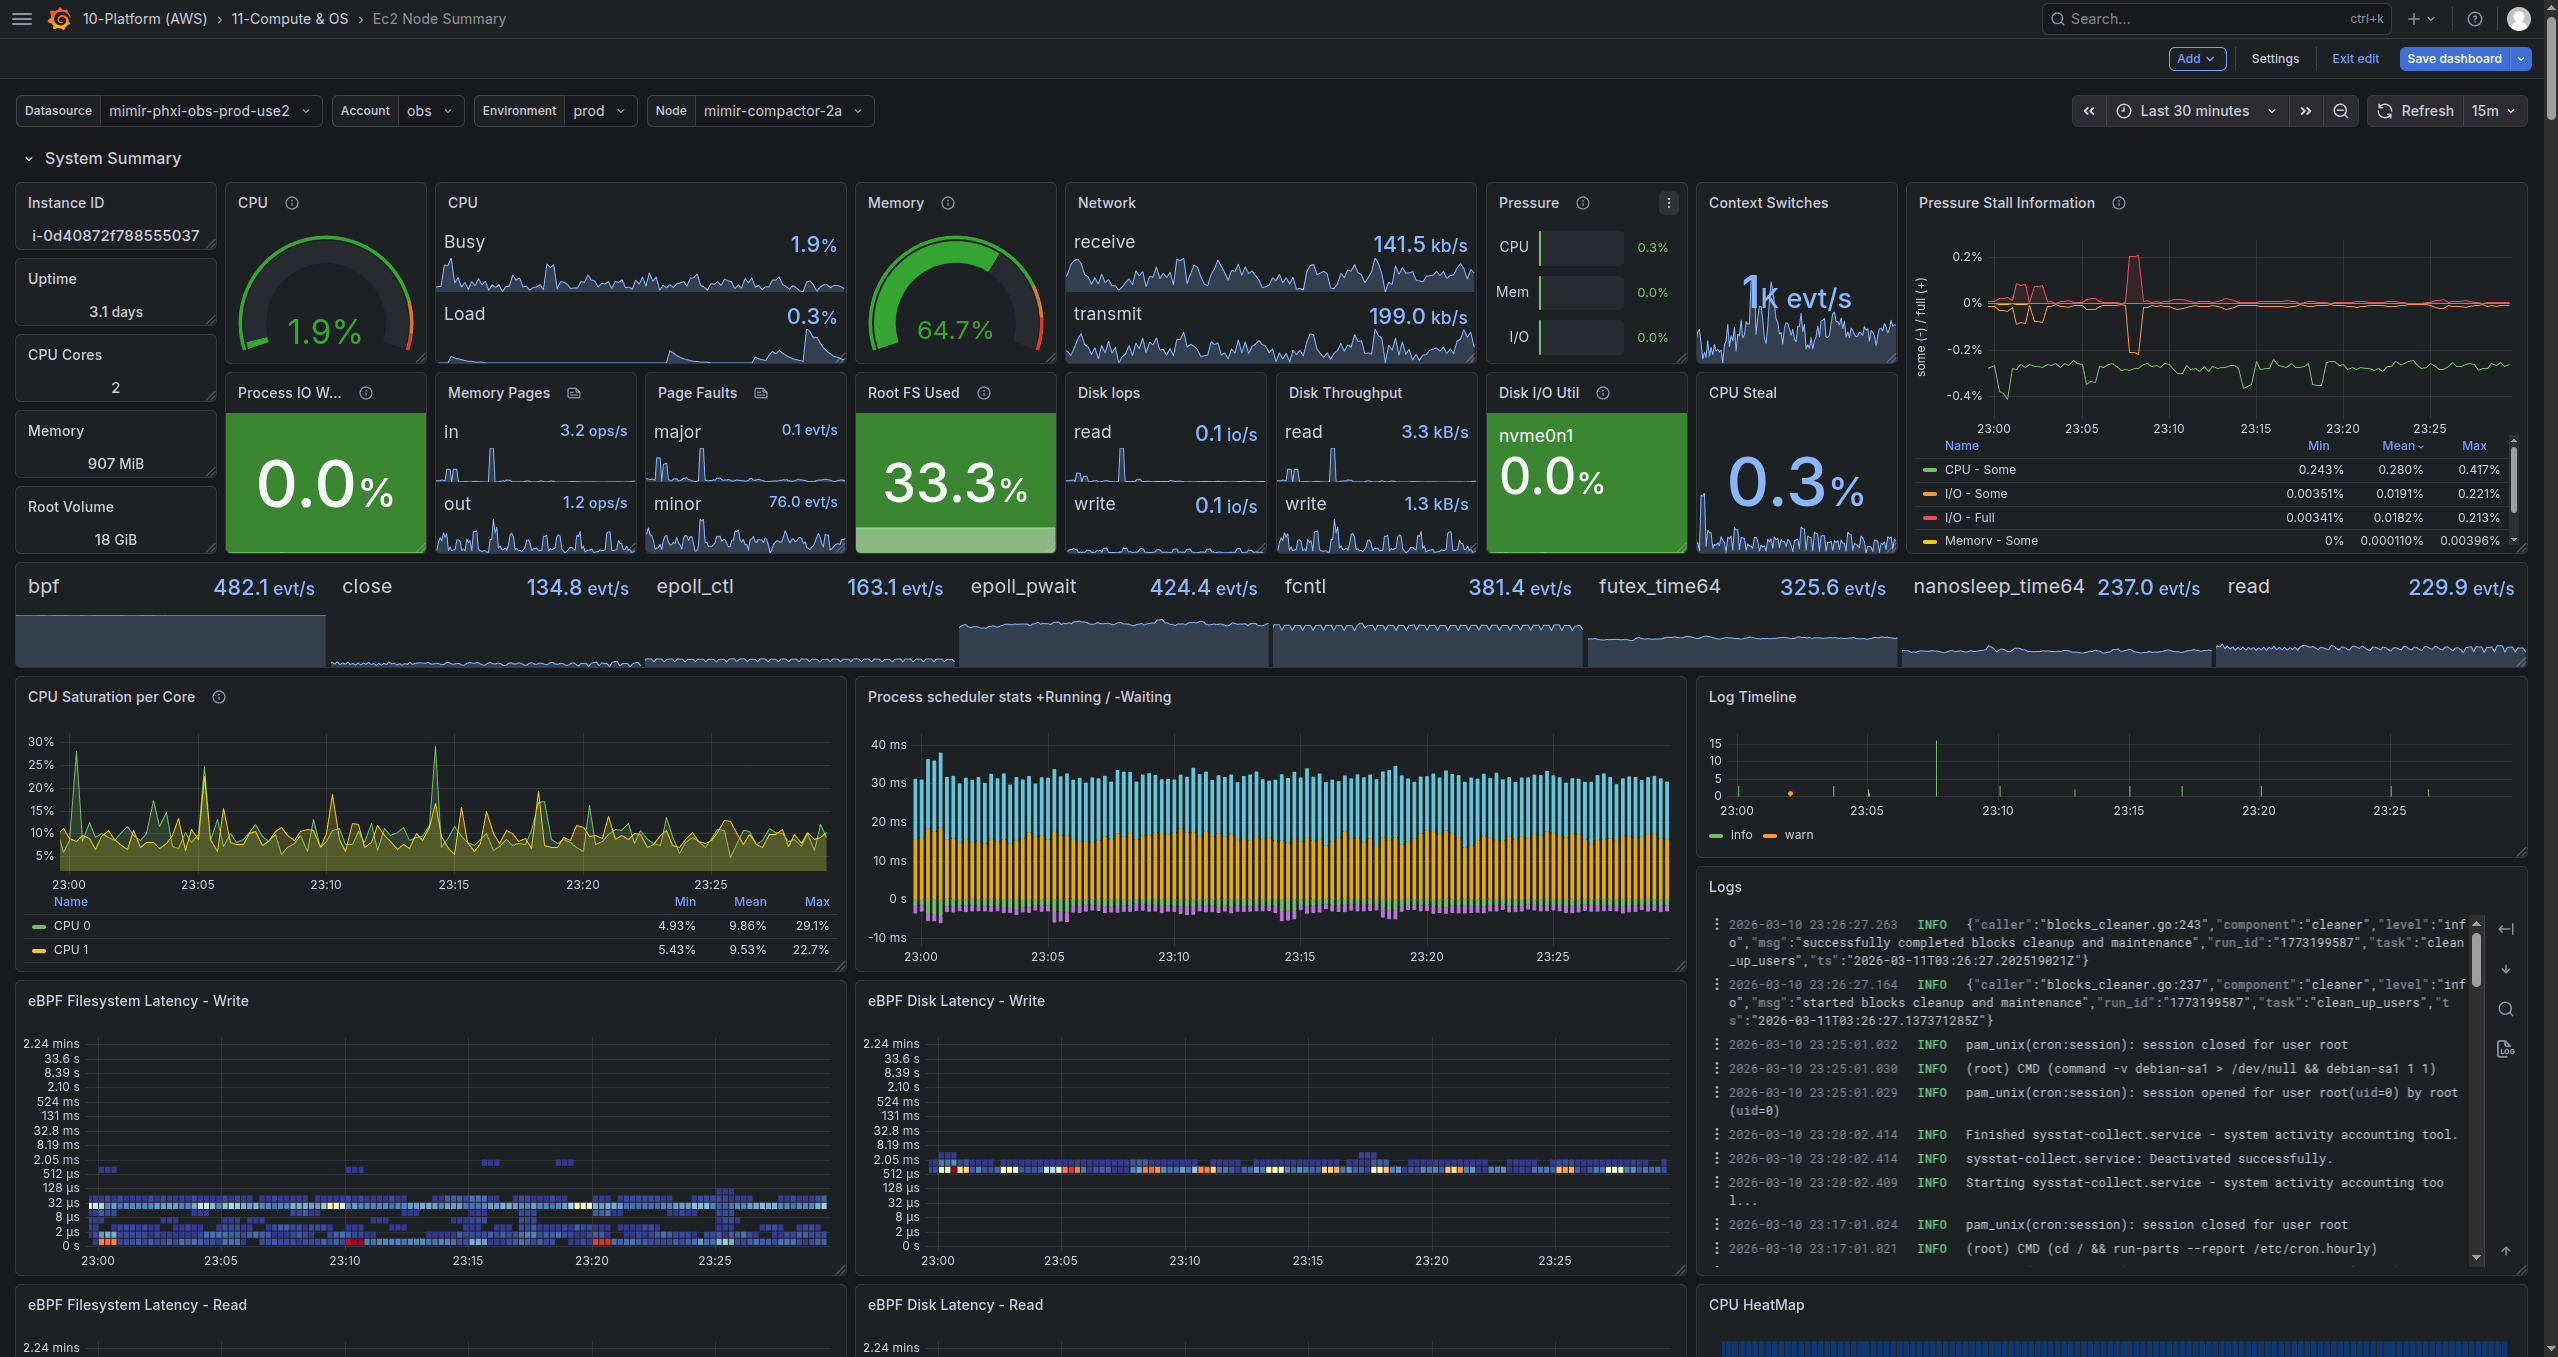
Node deep-dive dashboard, above-the-fold content Multi-tenant
The full stack is tenant aware. Each environment/account is isolated using a unique x-scope-orgid and runs its own Prometheus pair and pushes to the central Mimir, logs traces and profiles flow to the central ingest load balancer also. Per-tenant limits on ingest rates and label cardinality control blast-radius of a misbehaving environment while still allowing for traffic bursts.
What’s Next
My focus is on hardening and expanding the platform:
- I am exploring more ebpf data to collect for my ebpf_exporters.
- Integrating mTLS end-to-end using SPIFFE/SPIRE on both the ingest and query pipelines.
- Deep-dive into adversary emulation against the stack. I have an ever-growing list of ~50 attacks I want to run against my existing observability stack to identify weaknesses and mitigations I can apply.
- Expanding tool-use for Vigil, including regression test analysis using Tempo and Pyroscope.
- Iterating on Vigil prompts and re-analyzing historic alerts and triages.
- Creating runbooks and pre-defined remediation tools for Vigil.
- Centralized collectors per-env to relay to central ingress for increased isolation
- Buffering (kafka) in-between nodes and collectors, and between collectors and central ingest pipeline
The Journey
I have been running monitoring platforms since I was a teenager and Nagios first renamed from netsaint. Back then I was monitoring my homelab with nrpe and mrtg graphs. Over time I added Zabbix which provided some additional value in better visualizations but was not as well-tested and robust as Nagios. I moved on to Sensu around the same time as servers became cattle not pets and I needed to monitor a dynamic environment of short-lived ephemeral systems hosting microservices instead of a server named Zeus that hosts half of my infrastructure. Sensu worked well but it there was a lot of operational overhead between rabbitmq, redis, and the mTLS websockets the agents used for communication with the backend.
Eventually, I decided to re-build what I wanted from scratch. I started with Prometheus and researched the TSDB architecture and knew this was the direction I wanted to explore. Grafana provided very high quality visualizations with minimal work learning the promql syntax. I am mindful to avoid ‘vendor lock-in’ so I set out to research standards-based solutions for a longer-term storage engine for the metrics. Initially I was deciding between Thanos and VictoriaMetrics, with the latter looking better for my use-case and scale. However, that was quickly ruled out due to its architecture decisions around storage redundancy and recovery. Thanos didn’t quite match what I wanted - a central stateless, long-term, efficiently queryable system for metrics vs federating multiple backends.
When the need came to integrate logs I followed the same journey. Back in the Nagios days I wrote a system for ingesting rsyslog data and alerting on specific conditions and persisting the logs to Elasticsearch. That evolved into running the ELK stack when it was released. This time around, I wanted to stay standards-based and OTLP was the natural fit using otel-collector so I had an idea of the shape of the system I wanted. Loki ended up being ideal for my use-case and integrates very well with the existing Prometheus/Mimir/Grafana which is a nice bonus.
When it came to researching a tracing system, it was largely between Jaeger and Tempo. Jaeger seemed to be a little more mature at the time but I was not looking to integrate ElasticSearch into my stack after years of running the ELK stack with mixed results. Tempo used the same object storage backend as the rest of my stack and seemed to be less operational overhead to integrate and manage, and even more importantly is OTLP standards-based and ingests from otel-collector keeping my options open for the future. The close integration to the rest of my stack and ability to go from logs->traces, traces->logs, traces->profiles is very powerful.
For profiling the journey was the same, except with less options. Pyroscope seemed to fit well and given the tight integration to the rest of the stack was a natural fit. Same story being (largely) standards based and I was able to use otel-collector to collect and ship the OTLP profiles allowing my entire stack to stay standards-based. Pyroscope and the entire OTLP profiling landscape seems to be very actively in development and otlp-collector and Pyroscope both have opinions on schema version, so I recently changed to ingest system profiles via the Pyroscope http api with Alloy.
This system is evolving heavily daily. This was the state as of the date of this post.